Website Sales Funnel: Where You're Losing Customers and How to Fix It
You're spending money on ads, driving traffic to your site, and still not seeing enough sales. In most cases, the problem isn't the product or the price — it's that nobody is analyzing where exactly visitors leave your site without becoming customers. That's what a sales funnel is for: a tool without which sustainable conversion growth simply isn't possible.
In this article, we'll break down what a website sales funnel is, what stages it consists of, how to find where you're losing customers, and which tools — Google Analytics 4, Hotjar, and Crazy Egg — can turn guesswork into data.
What Is a Website Sales Funnel
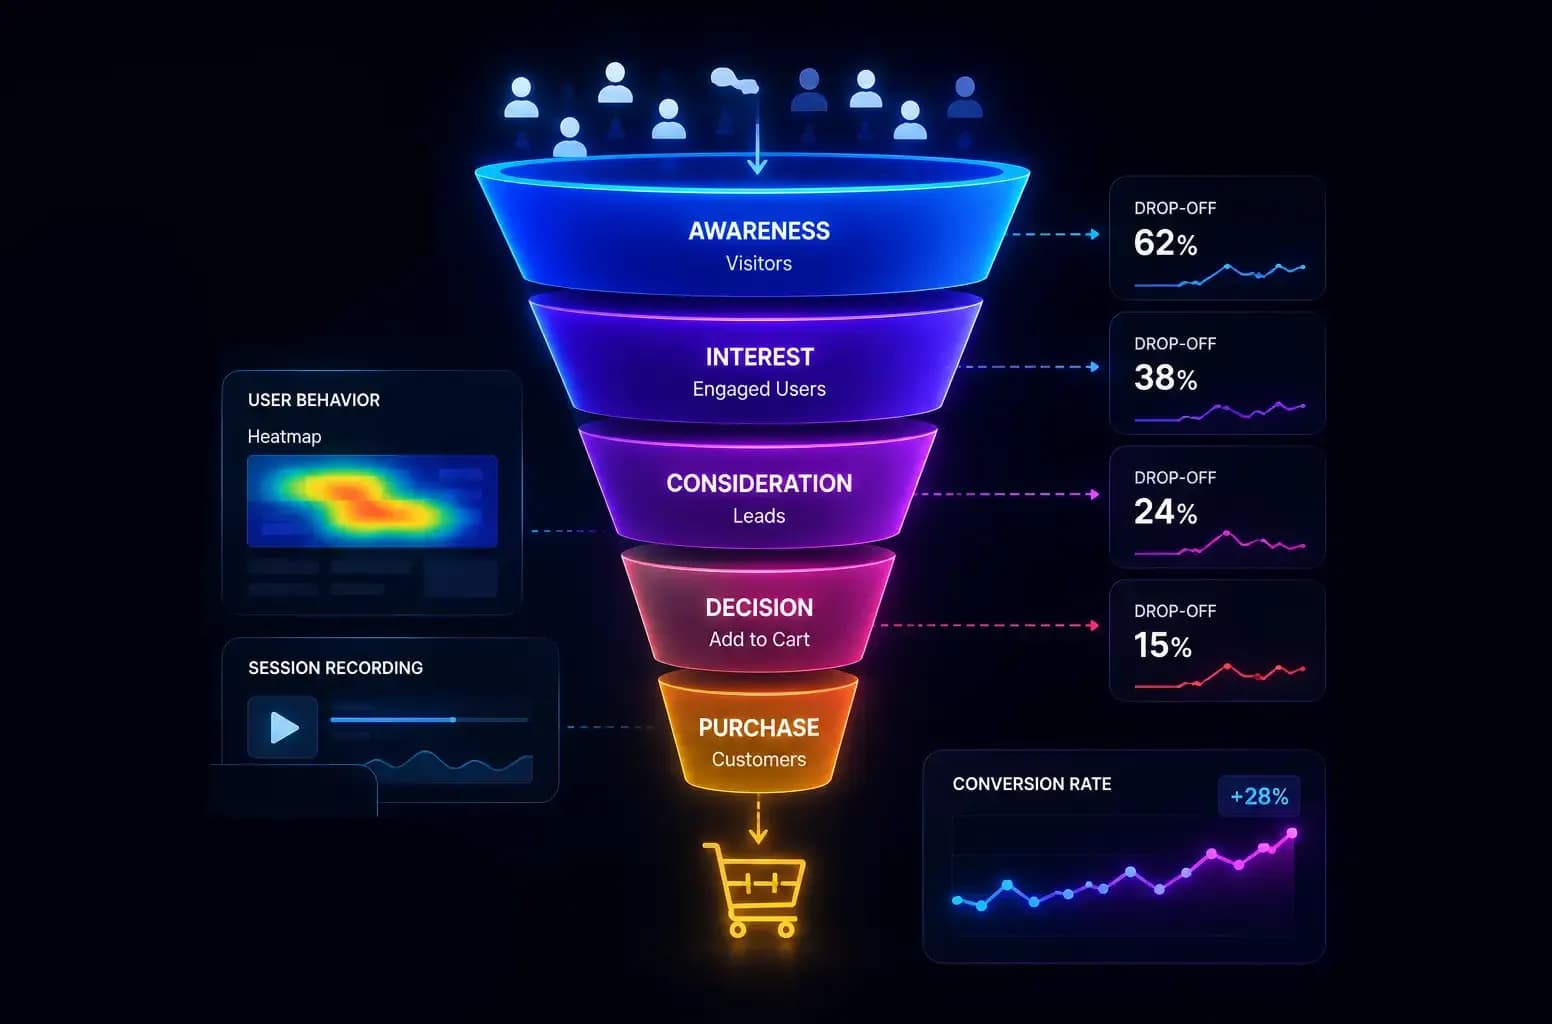
A sales funnel (or conversion funnel) is the path a user takes from their first contact with your website to a target action: a purchase, a form submission, a call, or a subscription. At the top of the funnel is a large number of visitors; at the bottom, a much smaller number who actually convert. Each stage narrows the audience, filtering out those who, for various reasons, aren't ready to move forward.
The classic funnel model consists of four levels:
- Awareness — a person discovers your brand through an ad, a search result, or a recommendation.
- Interest — they visit your site, browse pages, and explore your offer.
- Desire — they compare options, read reviews, and consider your product as a solution to their problem.
- Action — they complete an order, submit a form, or make a payment.
For e-commerce and service-based websites, this model is usually broken down into concrete steps: traffic source → landing page view → product or service page view → add to cart or form fill → checkout → order confirmation.
Why Funnel Analysis Is the Foundation of Conversion Growth
Without understanding the funnel, website optimization turns into guesswork: a business owner changes button colors or launches a new ad campaign, hoping it will somehow move the needle. Funnel analysis, instead, gives precise answers: at which step visitors drop off most often, how much time passes between stages, how behavior differs by traffic source or device, and what users do instead of moving to the next step.
With this data, you can fix the exact problem at the exact stage — instead of redesigning the whole site "just in case." This saves budget on both development and advertising, and delivers predictable, measurable results.
From First Click to Purchase: The Funnel in Practice
1. Traffic source and first click. The customer journey starts long before they land on your site — with a Google Ads campaign, a social media post, an organic search result, or a newsletter. What matters most at this stage is relevance between the promise made in the ad and what the person actually sees after clicking. If an ad promises a 20% discount and the landing page says nothing about it, the visitor leaves — and no amount of on-site optimization will fix that.
2. First impression: the landing page. The first 3–5 seconds on your site decide whether a person stays or closes the tab. Key retention factors include page load speed, a clear headline that immediately answers the user's search intent, and a strong visual focus on the target action. A slow site, intrusive pop-ups, or a chaotic page structure are the most common causes of instant bounce at this stage.
3. Exploring the offer. Once the first barrier is passed, users start exploring your product or service in more detail: product cards, specs, pricing, shipping or payment terms. What matters here is complete information, quality photos or videos, clear navigation, and the absence of technical friction like broken links.
4. Building trust. Before taking the target action, most users look for proof that your company can be trusted — reviews, case studies, guarantees, certifications, contact details. A lack of social proof at this stage is one of the main reasons a customer "almost bought" but changed their mind.
5. The target action: cart, form, checkout. This is the final and most critical stage of the funnel. It's where the most customers are lost — due to complicated forms, forced account creation, hidden extra costs (shipping, fees), a limited number of payment methods, or technical glitches during checkout.
6. Post-conversion stage. The funnel doesn't end at the "Buy" or "Submit" button. An order confirmation, a thank-you email, and a prompt follow-up from your team all influence whether a customer becomes a repeat buyer and leaves a positive review.
Where You're Actually Losing Customers
Based on widely observed user behavior patterns, the biggest conversion drops consistently happen at a few typical points:
- Immediate exit from the landing page — a mismatch between expectations and content, slow load times, or irrelevant traffic.
- Product page to cart — unclear pricing, missing variants (size, color, configuration), no shipping information.
- Cart to checkout — widely considered the most painful point in the entire funnel. Common causes: forced registration, too many form fields, unexpected extra costs, limited payment options, and no guest checkout.
- Mobile experience — a site that converts well on desktop can be nearly unusable on a smartphone due to small controls or clunky forms.
Finding these points is easier with a step-by-step analysis in Google Analytics 4. Under the Explore section, there's a dedicated Funnel Exploration report that lets you build a sequence of steps — from a site visit to a target event — and see exactly where, and in what proportion, visitors drop out of the funnel. The report supports up to ten steps, lets you compare segments (for example, mobile vs. desktop), and shows the time elapsed between steps. One important detail: by default, funnels in GA4 are "closed" — meaning only users who completed all steps sequentially from the very beginning are counted; anyone who "entered" the process at step two or three isn't counted until you manually switch the setting to "open."
This step-by-step breakdown is far more precise than simply looking at bounce rate, because it shows not just the fact that someone left, but the exact point in your site's logic where it happened.
Visualization Tools: Hotjar and Crazy Egg
Numbers from Google Analytics answer "how many" and "at which step" — but not "why" users behave the way they do. That's where behavior visualization tools come in: heatmaps, session recordings, and scroll maps.
Hotjar
Hotjar is one of the most widely used tools for qualitative user behavior analysis. Its core features relevant to funnel optimization:
- Heatmaps show where users click, hover, and how far they scroll down a page. If your call-to-action button sits below the point most visitors actually scroll to, that's a direct cause of lost conversions.
- Recordings let you watch a real user session: where they paused, where they clicked repeatedly on something that isn't a button (a sign of a broken interface expectation).
- Surveys let you ask visitors directly what stopped them from completing an action — often the fastest way to uncover a problem that numbers alone can't explain.
Crazy Egg
Crazy Egg specializes in visual analytics for individual pages:
- Confetti Report breaks down clicks by traffic source, device, and other segments — showing whether users from different ad campaigns behave differently.
- Scrollmap shows how far down the page most of your audience actually scrolls, which matters especially for long landing pages and product pages.
- Built-in A/B testing lets you test hypotheses about element placement without needing developers for every iteration.
The combination of quantitative data (GA4) and qualitative tools (Hotjar, Crazy Egg) is the standard approach in professional CRO (Conversion Rate Optimization) work: first, identify the problem step using numbers; then watch session recordings and heatmaps to understand the specific cause; only then formulate a hypothesis to test.
How to Optimize Every Stage of the Funnel
- Build your funnel in GA4. Define your key target action (purchase, form submission, call) and the steps leading up to it.
- Find the step with the highest drop-off rate — that's priority number one, not whatever page "feels" problematic.
- Add heatmaps and session recordings on the problem page. A few dozen real session recordings are usually enough to spot recurring patterns.
- Form a hypothesis. For example: "Users don't see the checkout button because it sits below the active scroll area on mobile."
- Make one change and test it. Change one element at a time so you know exactly what drove the result.
- Compare before and after in the same Funnel Exploration report, and repeat the cycle for the next problem stage — funnel optimization is an ongoing process, not a one-time fix.
Common Mistakes When Working With a Sales Funnel
- Optimizing without data — changing the site based on personal preferences rather than actual user behavior.
- Overly complicated checkout forms — every extra field is another barrier and a potential reason for cart abandonment.
- Ignoring the mobile experience, even though a significant share of traffic comes from mobile devices, so the funnel should be analyzed separately for each device type.
- Skipping re-analysis after changes — optimizing one stage can affect behavior at the next, so it's important to track the whole chain, not just one metric.
- Focusing only on the top of the funnel, pouring the entire budget into traffic acquisition while the biggest losses happen at checkout.
Conclusion
A sales funnel isn't an abstract marketing concept — it's a working tool that turns guesswork about customer behavior into concrete, measurable data. Building a funnel in Google Analytics 4 shows you exactly where you're losing the most visitors, while visualization tools like Hotjar and Crazy Egg explain why. This two-step approach — numbers first, then behavior — lets you optimize your site systematically, step by step, instead of redesigning things at random.
If you want your traffic to actually convert into customers, it's worth treating your sales funnel as a living business management tool — reviewed regularly, with every stage of the customer journey deliberately designed rather than patched up after another lost order.